Metrics board
The Metrics Board is a canvas where you place charts, tables and form controls that load their data from SQL queries. Use it to build a simple live report or a small internal tool in a few minutes.
Open the Metrics Board
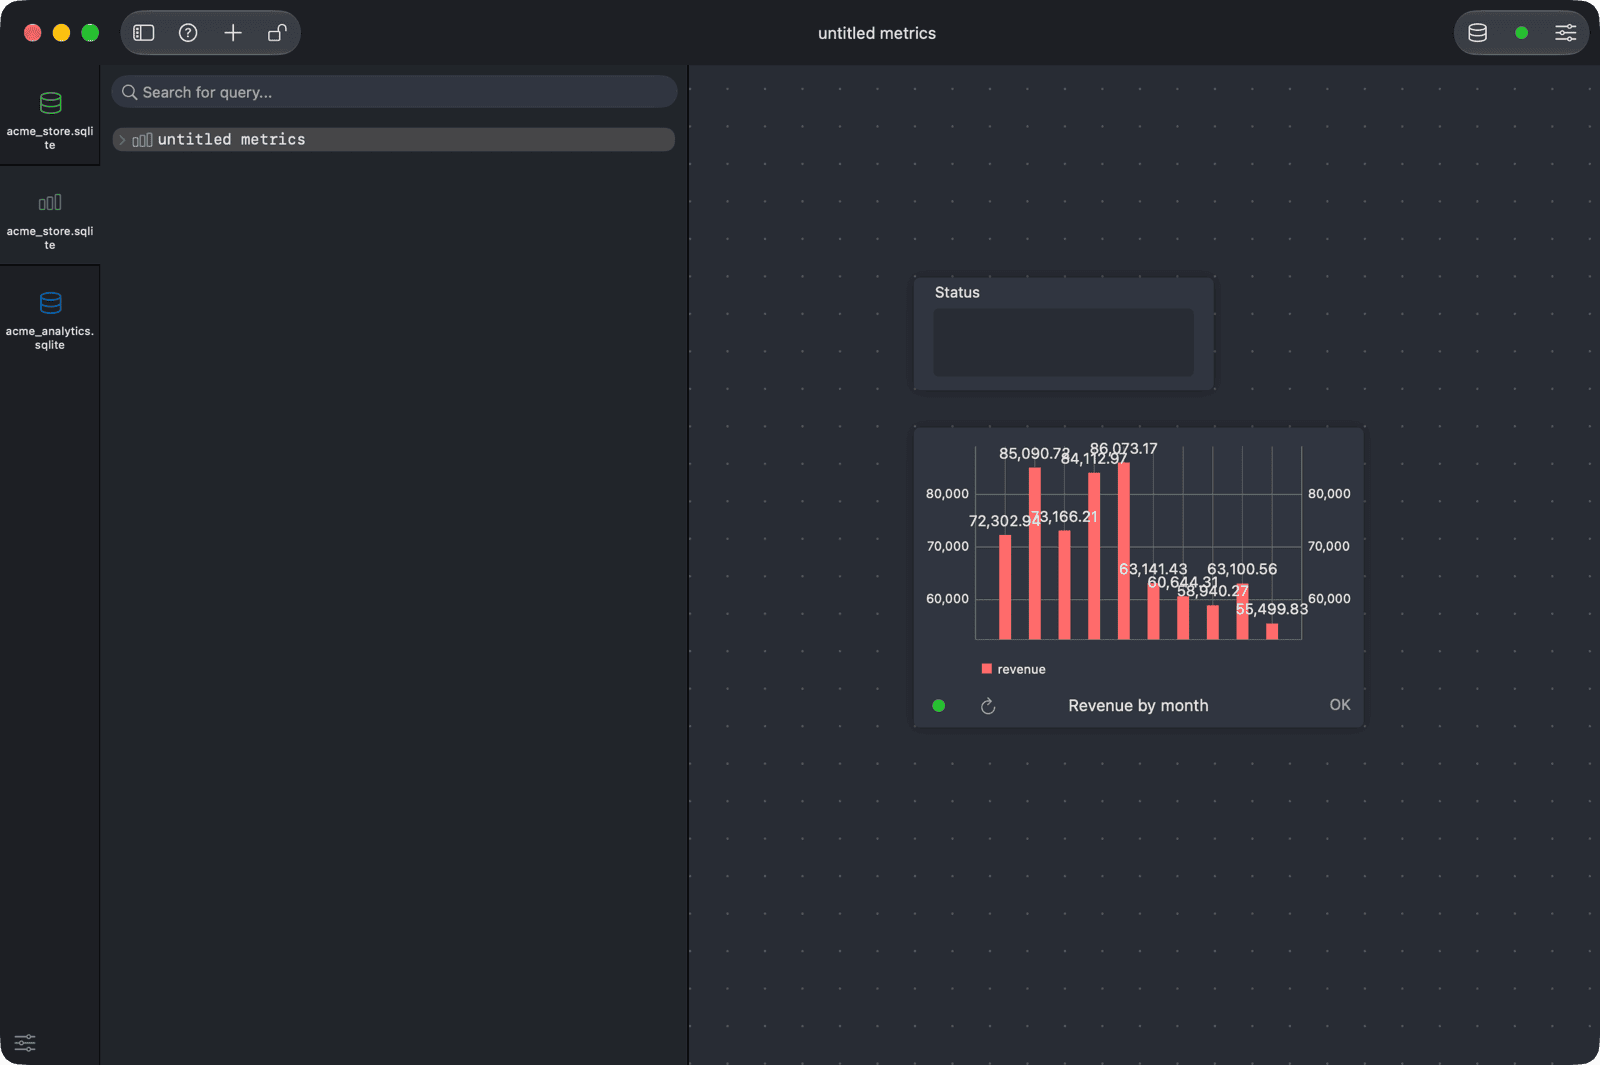
Click the Metrics button on the toolbar, or navigate to Tools > Show Metrics Board.
The left sidebar lists your boards. Right-click it to create a New... board, or to Rename..., Duplicate, Delete, Import Metrics Board or Export Metrics Board (to share a board as a file).
The toolbar of the Metrics Board window has these buttons:
- Status: start or stop refreshing data on the board.
- Add: add a new object to the board.
- Lock: lock the board so objects can't be moved or edited by accident.
- Grid: show the canvas grid, and show or hide the connections between objects.
- Database: go back to the workspace.
Add objects
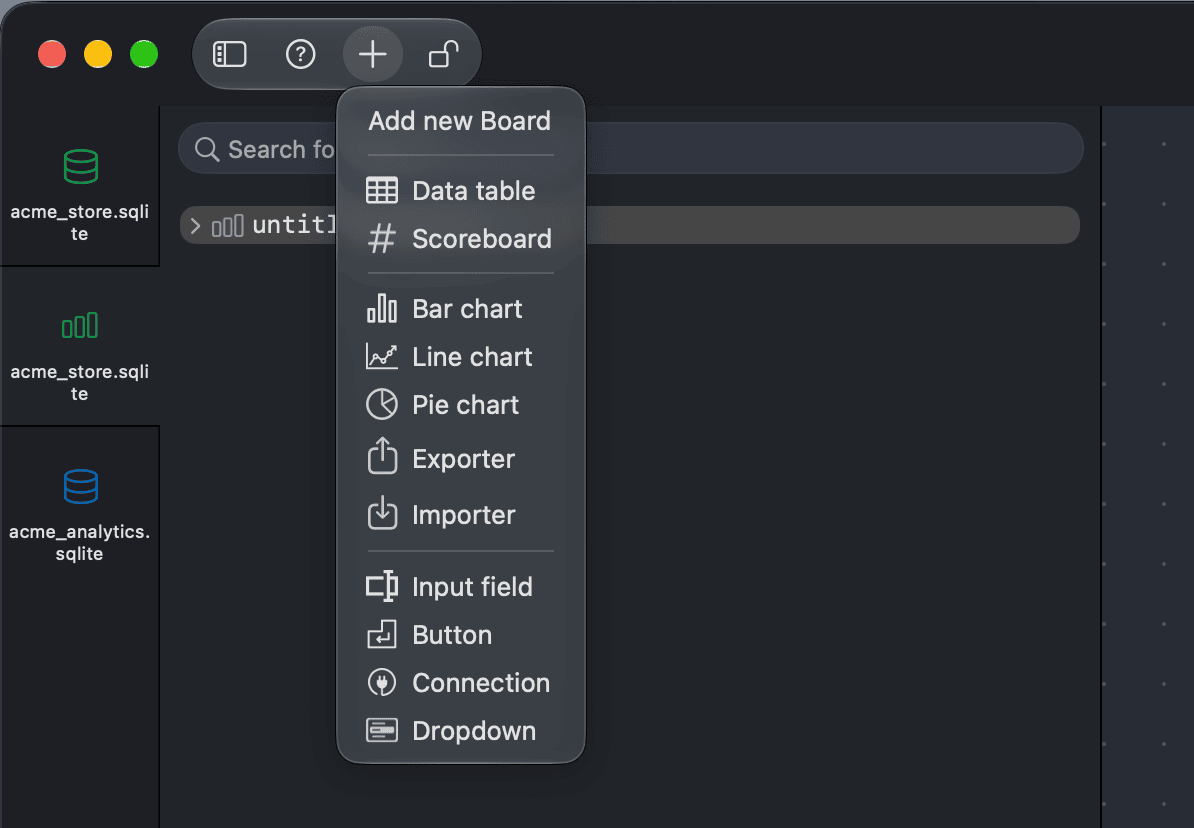
Click Add on the toolbar, or right-click the canvas and choose Add, then pick an object:
| Object | What it does |
|---|---|
| Data table | Shows the result of a query as a table. |
| Scoreboard | Shows a single value (the Score) with a Detail line. |
| Bar chart, Line chart | Draw the result of a query. Choose the column for the x-axis and one or more columns for the y-axis. |
| Pie chart | Draws a pie from a label column and a value column. |
| Exporter | Exports the result of a query to a CSV, JSON, SQL or Excel file. |
| Importer | Imports a CSV, JSON or SQL file into a table. |
| Input field | A text field whose value is sent to other objects. |
| Dropdown | A list of values (fixed, or loaded with a query) whose selection is sent to other objects. |
| Button | Sends an event to the objects it's connected to. |
| Connection | Makes the objects connected to it use another TablePlus connection and database. |
Drag an object to move it and drag its edges to resize it. Click an object to show its settings.
Create a chart or a data table
-
Add a Bar chart, Line chart, Pie chart, Data table or Scoreboard.
-
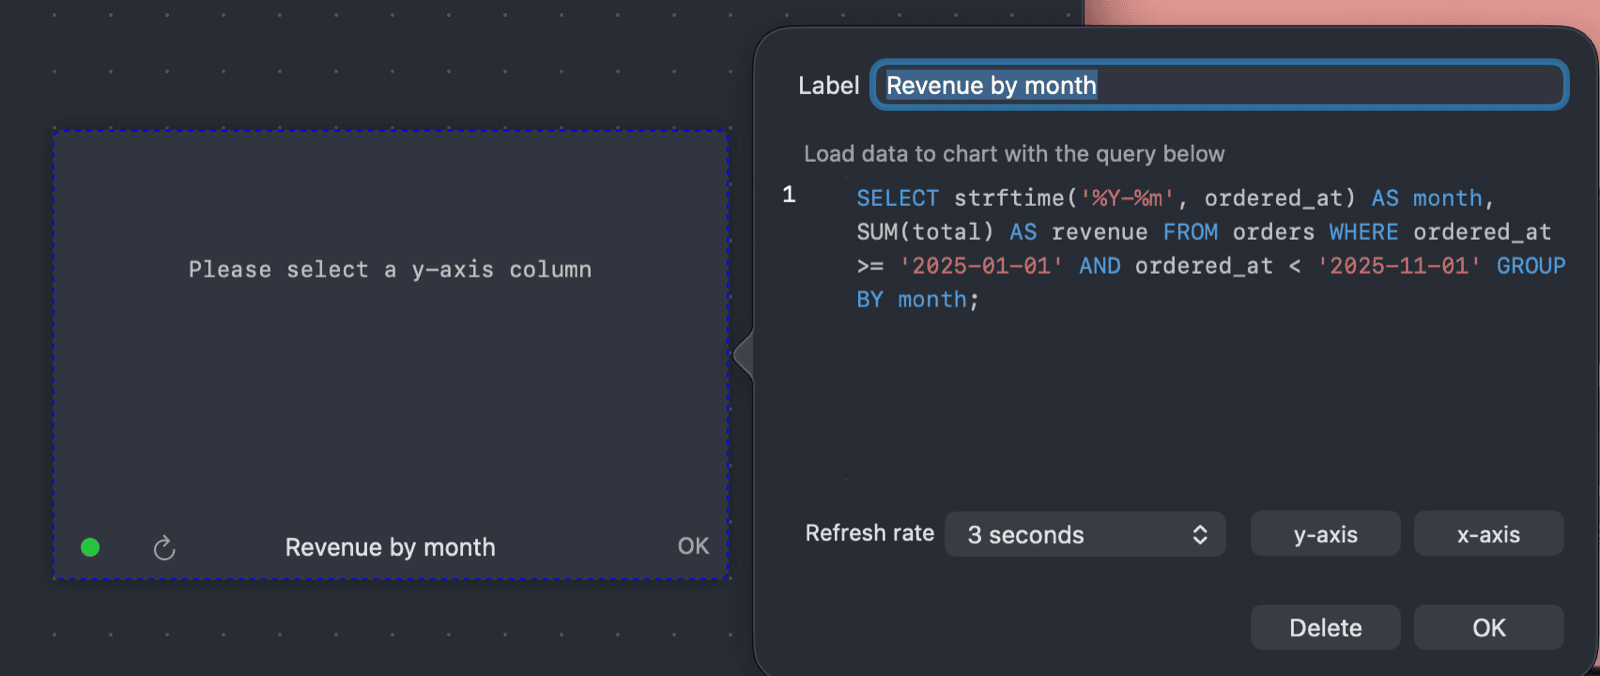
Click the object to open its settings.
-
Enter a Label and the query that loads the data, for example:
SELECT strftime('%Y-%m', ordered_at) AS month, SUM(total) AS revenue FROM orders GROUP BY month ORDER BY month; -
For a chart, choose the x-axis and y-axis columns (or the label and value for a pie chart). For a scoreboard, choose the Score and Detail columns.
-
Choose the Refresh rate:
- A time interval from 1 second to 30 minutes: the object reloads its data on that interval.
- Refresh on Event: the object reloads when another object (an input field, dropdown or button) sends it an event.
- Do not auto refresh: the object loads once. Use the refresh button on the object to reload it.
-
Click OK.
You can also build a chart from a query result: open the Chart tab of the result in the SQL editor and click Add to Metrics Board. See Working With Query Results.
Filter with an input field or a dropdown
Input fields and dropdowns pass a value to the queries of other objects:
-
Add a chart, table or scoreboard and set its Refresh rate to Refresh on Event.
-
In its query, refer to the value with a
$variable. String values are inserted as typed, so quote them in the query:SELECT first_name, last_name, email, city FROM customers WHERE country = '$country'; -
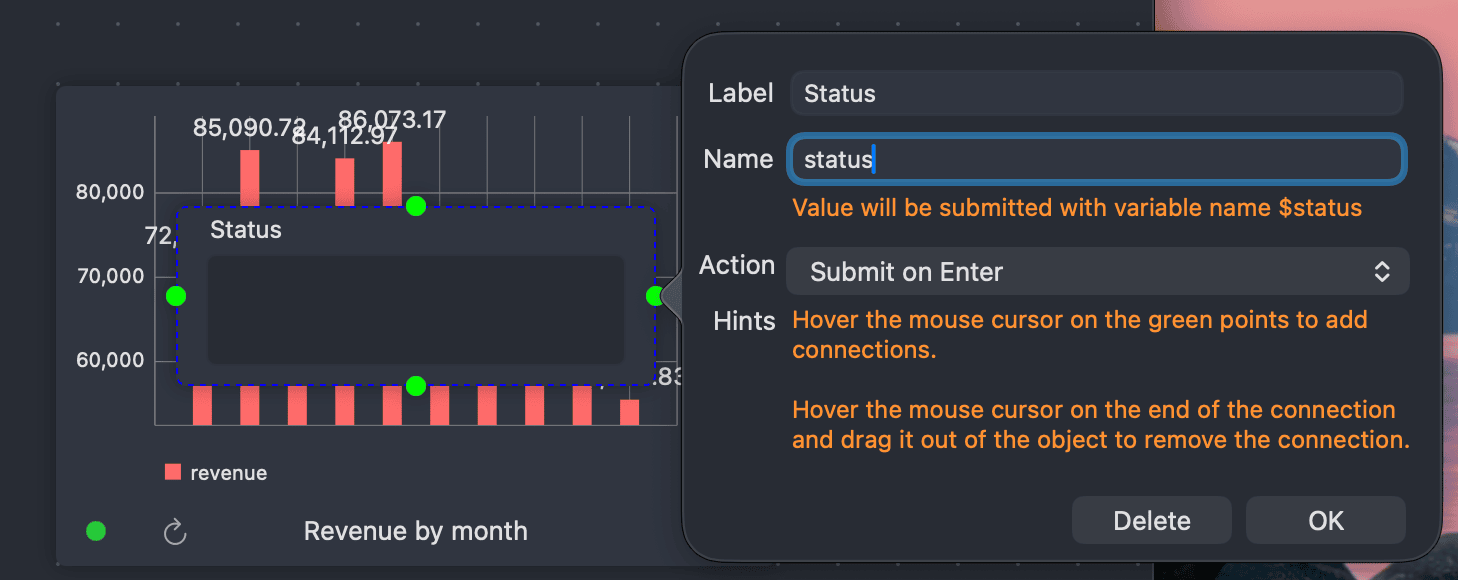
Add an Input field (or a Dropdown). In its settings, set the Name of the variable (here
country; the default isinput) and choose when it submits its value: Submit on Enter, Submit on End Editing or Submit on Event (for a dropdown: Submit on Value Change or Submit on Event). -
Connect the input field to the object: select the input field and drag from its connection point to the object.
When the input field submits, the connected object reloads with the new value.
A Button sends an event to the objects it's connected to. Connect a button to objects set to Refresh on Event (or Submit on Event) to reload or submit them on click.
Use another connection
By default, the objects run their queries on the connection of the workspace that opened the board. To use a different connection, add a Connection object, select a TablePlus connection and a database in its settings, and connect it to the objects that should use it. The Safe Mode of that connection applies to those objects.